
Understanding Social Influence in Collective Product Ratings
Online platforms commonly collect and display user-generated information to support subsequent users’ decision-making.
However, studies have noticed that presenting collective information can pose social influences on individuals’ opinions and alter their preferences accordingly.
To deepen understanding of the social influence and the underlying cognitive mechanisms to address potential biases, we conducted a laboratory study to investigate how products’ ratings and reviews influence participants’ stated preferences and cognitions using their Electroencephalography (EEG) signals.
-
My Role
Research Assistant
Data Collection
Data Analysis
Experiment Design
Define Usability Metrics
-
Team
Fu-yin Chreng
Yinhao Jiang
Jingchao Fang
Xin Chen
Taejun Choi
Hao-Chuan Wang
-
Duration
6 Months
Problem

Viewing collective opinions provided by prior users are everyday interactions in online platforms today. For example, learning the opinions of others through ratings or reviews can help them assess the quality of a product and increase their confidence associated with online purchasing and selecting decisions.
Prior studies suggested that the formation of preferences and rating decisions are not independent of external influence, and the temporal interdependency of ratings collected from different users revealed the existence of human biases in collective rating systems.
For example, raters who are exposed to prior ratings may be inclined to lower their scores of preference and converge to negative assessments of the items. People asked to re-pick preferred items after viewing others’ choices also tend to revise those decisions.
Investigate how the display of collective information (i.e., ratings and reviews) influence customers’ preferences to bridge the gaps of understanding for research and design?

Field-based data analysis
To verify the presence of social bias in online product ratings, We first conducted a field study in which we analyzed a dataset of product ratings collected from Amazon.com. From 100 random products, we observed a downward trend of the mean of all products’ ratings as the date increased. Regression analysis confirmed that there is a negative association between the mean of preference rating and the timestamp order. As such, no matter when the product entered the market, the mean of preference rating decreased over time. This confirms previous researchers’ findings.
Experiment Design
The purpose of the experiment is to understand the mechanism of social influence underlying the users’ preference and their cognitive responses when exposed to others’ opinions. So, the structure of the experiment should help us assess the changes between participants’ initial preference rating and their altered rating after seeing the opinions of others.
-

The participants are asked to rate their preferences for each product one by one on a 5-point scale in the fashion of “star ratings” to collect participants’ stated preferences of the products without any intervention. The goal of the first phase is to collect the participants’ initial preference to the products used in the experiment without exposing to any collective social information.
-

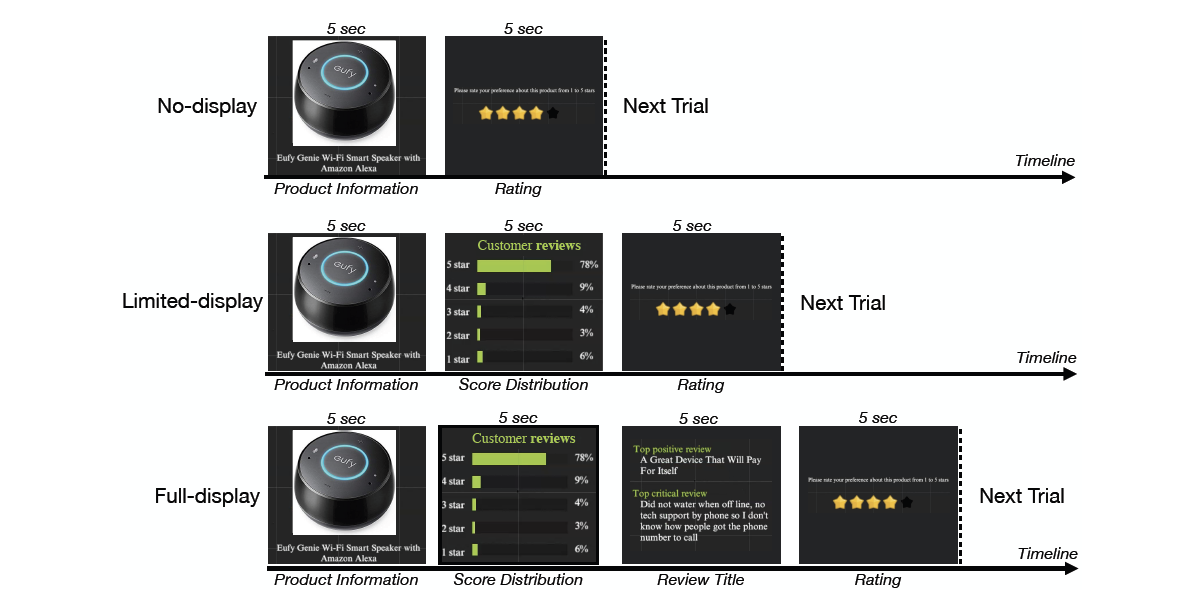
In the second phase of the study, there are three display conditions by manipulating the types of collective information to display before participants re-rating products, either displaying only rating score distribution or displaying both rating score distribution and titles from the most positive and negative review. The last condition is the baseline condition in which no collective information was presented to the participants.
Experiment Materials

We sampled and crawled the images and user evaluations of 90 products under the category of “Smart Home Devices and Systems” from Amazon.com.
For each product, we collected the landing image, title of the product, its average rating, rating distribution, and also the customer reviews. To control participants’ burden of reading long reviews, we chose to collect the titles of top positive and negative reviews.
To minimize the branding effect and individual difference, we crawled the “new to smart home” categories and manually removed unqualified products such as products with low resolution landing images, products with no reviews and ratings, and products with similar appearance but different names.
Experiment Setup

For the 90 products, the average of all products’ mean rating is 3.63 with standard deviation of 0.61. The average price is $128.9 and 90% of products lay within the price range between $0 to $400.
We recruited 30 participants (15 male and 15 female) with ages ranging from 20 to 29 years old (SD = 2.43).
For measuring EEG signal in the prefrontal cortex, we used the portable and commercial-grade EEG headset, Looxid Link. Looxid Link attached six dry flexible EEG electrodes in the prefrontal cortex to collect participants’ EEG signal from the AF3, AF4, Fp1, Fp2, AF7, and AF8 channels followed by EEG 10-20 system were measured and collected with the bandpass filter of 1-50 Hz and sampling rate of 500 Hz.
Conformity Metrics

𝑥 ′ = mean of social ratings - individual’s first rating
𝑦 ′ = individual’s second rating - individual’s first rating
conformity score = 𝑡𝑎𝑛𝜃 = 𝑦 ′ / 𝑥 ′
Social conformity represents the force to adjust one’s opinion and behavior when perceiving the incongruence with those of group’s.
The magnitude of conformity score reveals the degree of conforming or not conforming. When |conformity score| is large, the individual’s preference is substantially changed after seeing the collective information relative to the difference between the mean of social ratings and the individual’s initial rating, which implies that the individual highly conforms to others’ preference, and vice versa.
Results

The behavioral data showed that different displaying conditions have main effects on reaction time and degree of conformity when participants rate the products.


The EEG result showed that the full-display condition attracts the most attention, elicited the highest level of working memory, and induced the most positive valence.
Implications of the collective rating system
Although displaying the ratings and reviews of others could induce social conformity, showing collective social information is still an important design feature in social computing systems to facilitate social interactions and let people utilize collective intelligence from the crowd.
How to increase users’ awareness, so that unwanted social conformity mainly motivated by the desire of social approval can be prevented or can be mitigated?
Help users to be more aware of their emotional status when they are exposed to collective social information
by employing state-of-art linguistic analysis of sentiments, the interface can display warning messages along with emotionally provocative reviews.
Monitor and display emotional status and valence as feedback to users when they are viewing social information
collective rating systems can choose to display the reviews that are the most informative or pertinent in default instead of the most positive and critical reviews
utilizing latest sensing techniques like smart watches to help users avoid being trapped in the reinforcement learning process of conforming to others due to the rewarding motivations of potential social approval
Better visualization design to display collective social ratings
control the level of social presence people perceived while still provide useful “de-socialized” evaluation from the previous users